")
")
")
")

Data get only value when they can and are used for decision-making. This requires skills within how to process data and especially skills within how to present data.
Validity and reliability of the data are key issues to be considered in the data processing phase and cover key questions like:
- Did the data collected data cover the issue and topic we wanted to cover?
- Would others using the same methods reach the same conclusions?
- Can we trust the conclusions we find?
The presentation of the data are often the key tool to bring the figures to life and to be understood. Most people will make their conclusions based of the visualization on the data. It is important to select ways to present the data in ways that present the conclusions, so people see the conclusions clearly. Excel offer a number of alternatives of which we have seen especially good feedback on the use of spider-grams.
This section will present some of our results within how to process and present data.
Data processing and presentation
The processing and presentation of data is partly a technical job that needs a bit of experience in Excel. Moreover, it is important to have a good idea of the kind of information required by the collaborating stakeholders, in order to have a clear image of the issues at stake for discussion and decision-making.
Data processing and presentation must accommodate a good discussion with the stakeholders involved. It is not up to the data collectors to make choices for them. This means overview and detail, text and images.
Job profile corrections by the companies
The job profiles are used as measurement instruments but are also subject to evaluation and adjustment. The work evolves due to a variety of trends and developments. Some companies are early adaptors, others are slow followers and most of them are somewhere in between. Changes have to become adopted by the last group to become a reason for adjustment.
It’s (mainly) up to the company/sector representatives to decide on whether or not to make changes. This requires some version control and administration of changes made over time. If changes are made they must be properly shared with all stakeholders involved and made public in an adequate way. It is up to the collaborating VET and labour partners to decide on the consequences of the changes for the qualifications and end-term documents involved and up to the corresponding VET suppliers to adjust the curricula and learning materials to them.
A lot of changes in the work will be too small to have effect on the qualification or curriculum but can be big and concrete enough to be picked up in the lessons, exercises and learning materials. This means it is good to have companies involved in reviewing them without waiting for the (slow process of) qualifications to be adjusted.
Processing task assessment data
The assessment forms are designed for optimal use by the respondents which does not necessarily lead to easy processable or presentable data. This means that symbols have to be converted to numeric values to be presented in bar charts or radar plots:
The “✔” symbol of the forms can be replaced by a 7 (out of 10) and for visual recognition be marked in light green.
The “-“ symbol can replaced by a 5 and highlighted in red.
The “+” can be replaced by a 9 and highlighted in dark green.
The colours will help you interpreting the results.
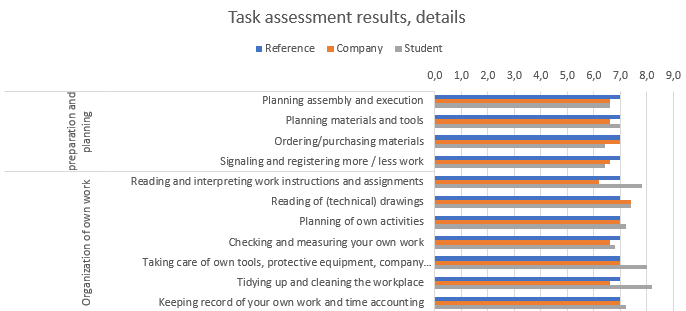
The results of a task assessment by 5 companies can be combined in one table. This enable you to calculate averages on tasks and aggregate them to clusters. The results will then look like this:
|
Task assessment Electrician (company) |
standard |
1 |
2 |
3 |
4 |
5 |
Average |
Difference |
Cluster |
|
|
Work preparation and planning |
Planning assembly and execution |
7 |
7 |
7 |
5 |
7 |
7 |
6,6 |
-0,4 |
6,7 |
|
Planning materials and tools |
7 |
7 |
7 |
7 |
7 |
5 |
6,6 |
-0,4 |
||
|
Ordering/purchasing materials |
7 |
7 |
7 |
7 |
7 |
7 |
7,0 |
0,0 |
||
|
Signalling and registering more / less work |
7 |
7 |
5 |
7 |
7 |
7 |
6,6 |
-0,4 |
||
|
Organization of own work |
Reading and interpreting work instructions and assignments |
7 |
7 |
7 |
5 |
7 |
5 |
6,2 |
-0,8 |
6,6 |
|
Reading of (technical) drawings |
7 |
7 |
7 |
9 |
7 |
7 |
7,4 |
0,4 |
||
|
Planning of own activities |
7 |
7 |
7 |
7 |
7 |
7 |
7,0 |
0,0 |
||
|
Checking and measuring your own work |
7 |
7 |
5 |
7 |
7 |
7 |
6,6 |
-0,4 |
||
|
Taking care of own tools, protective equipment, company clothing and company car |
7 |
7 |
7 |
7 |
7 |
7 |
7,0 |
0,0 |
||
|
Tidying up and cleaning the workplace |
7 |
7 |
5 |
7 |
7 |
7 |
6,6 |
-0,4 |
||
|
Keeping record of your own work and time accounting |
7 |
7 |
7 |
7 |
7 |
7 |
7,0 |
0,0 |
||
|
Warehouse and stock management |
Placing orders at warehouse or work planning |
7 |
7 |
7 |
7 |
7 |
7 |
7,0 |
0,0 |
7,0 |
|
Receiving and storing goods |
7 |
7 |
7 |
7 |
7 |
7 |
7,0 |
0,0 |
||
|
Checking received goods |
|
|
|
|
7 |
|
||||
|
Processing of packaging, residual material or return products/material |
7 |
7 |
7 |
7 |
7 |
7 |
7,0 |
0,0 |
||
|
Managing the stock |
7 |
7 |
7 |
7 |
7 |
7 |
7,0 |
0,0 |
||
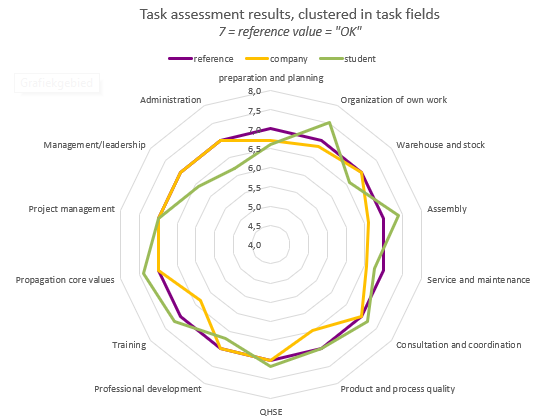
Once the results of the different types of respondents are available in such an Excel sheet, they can be easily copied and combined to be presented in attractive and informative other ways:
like a radar plot for the aggregated results in task fields or a bar chart of average score per task.
Processing ability assessment data
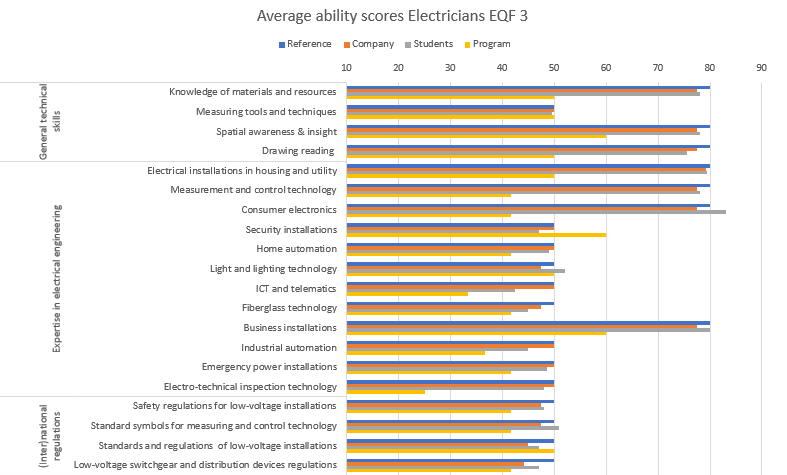
The processing of the ability scores is a little more complex. The letters (A,B,C) indicating the levels required as well as the “-“ and “+” scoring have to be replaced by numeric values as shown in this table.
|
Standards |
Scores |
|||
|
original |
numeric |
✔ |
- |
+ |
|
A |
25 |
25 |
15 |
30 |
|
B |
50 |
50 |
35 |
60 |
|
C |
80 |
80 |
65 |
90 |
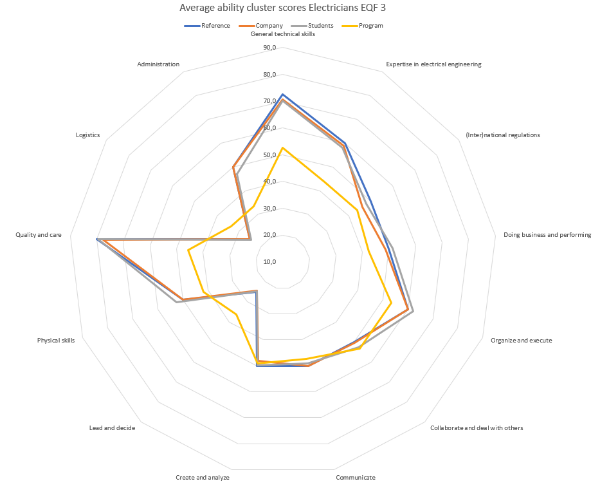
A colour scheme for deviating values makes it easier to see the patterns in the scoring. The result will look like the example below, showing the ability scoring of 5 companies for freshly graduated electricians, the averages per ability and the aggregated averages per cluster.
|
Ability Assessment Electrician (company) |
Ref. |
New |
1 |
2 |
3 |
4 |
5 |
av. Score |
av. Ref |
average score |
difference |
||
|
Technical Knowledge & skills |
General technical skills |
Knowledge of materials and resources |
C |
80 |
80 |
80 |
80 |
80 |
65 |
78 |
72,5 |
65,00 |
-7,50 |
|
Measuring tools and techniques |
B |
50 |
50 |
35 |
50 |
50 |
65 |
50 |
|||||
|
Spatial awareness & insight |
C |
80 |
80 |
80 |
80 |
80 |
65 |
78 |
|||||
|
Drawing reading |
C |
80 |
80 |
80 |
80 |
80 |
65 |
78 |
|||||
|
Expertise in electrical engineering |
Electrical installations in housing and utility |
C |
80 |
80 |
80 |
90 |
80 |
65 |
79 |
60 |
57,50 |
-2,50 |
|
|
Measurement and control technology |
C |
80 |
80 |
65 |
80 |
80 |
80 |
78 |
|||||
|
Consumer electronics |
C |
80 |
80 |
80 |
65 |
80 |
80 |
78 |
|||||
|
Security installations |
B |
50 |
50 |
50 |
50 |
50 |
50 |
50 |
|||||
|
Home automation |
B |
50 |
50 |
50 |
50 |
50 |
50 |
50 |
|||||
|
Light and lighting technology |
B |
50 |
50 |
50 |
35 |
50 |
50 |
48 |
|||||
|
ICT and telematics |
B |
50 |
50 |
50 |
50 |
50 |
50 |
50 |
|||||
|
Fibreglass technology |
B |
50 |
50 |
50 |
35 |
50 |
50 |
48 |
|||||
|
Business installations |
C |
80 |
80 |
80 |
80 |
80 |
65 |
78 |
|||||
|
Industrial automation |
B |
50 |
50 |
50 |
50 |
50 |
50 |
50 |
|||||
|
Emergency power installations |
B |
50 |
50 |
50 |
50 |
50 |
50 |
50 |
|||||
|
Electro-technical inspection technology |
B |
50 |
50 |
50 |
50 |
50 |
50 |
50 |
|||||
|
Knowledge of (Inter)national standards and regulations |
Safety standards/regulations for low-voltage installations |
B |
50 |
50 |
50 |
50 |
50 |
35 |
48 |
50 |
35,00 |
-15,00 |
|
|
Standard symbols for measuring and control technology |
B |
50 |
50 |
50 |
50 |
50 |
35 |
48 |
|||||
|
Standards and regulations for operational management of electrical low-voltage installations |
B |
50 |
50 |
50 |
35 |
50 |
35 |
45 |
|||||
|
Standards and regulations for low-voltage switchgear and distribution devices |
B |
50 |
50 |
30 |
50 |
50 |
35 |
44 |
|||||
After combining the average scores of the various types of respondents they can be presented in graphics like the radar plot for ability clusters and bar chart for single abilities
Processing VET Classification data
The processing of classification outcomes of VET programmes and providers concerned is comparable with ability scores to create a similar result for presentation.
Questionnaire and interview responses
The students’ response is worth processing in Excel. The multiple choices can be easily translated into numeric scales from 5-1, 4-1 and 3 -1 or into y/n. A colour scheme shows the variation in scores.
|
Student Questionnaire |
1 |
2 |
3 |
4 |
5 |
6 |
7 |
8 |
9 |
10 |
|
|
appreciation of … |
Programme |
4 |
5 |
5 |
3 |
4 |
5 |
5 |
4 |
5 |
4 |
|
School |
4 |
4 |
5 |
3 |
3 |
4 |
4 |
4 |
4 |
4 |
|
|
Work placement companies |
4 |
5 |
5 |
3 |
3 |
4 |
5 |
4 |
4 |
4 |
|
|
Work itself |
4 |
5 |
5 |
4 |
3 |
4 |
5 |
4 |
5 |
4 |
|
|
intention to … |
Work after VET programme |
y |
y |
y |
y |
y |
y |
y |
y |
y |
y |
|
Advanced training after iVET programme |
n |
n |
y |
n |
n |
n |
n |
? |
n |
y |
|
|
expect to … |
Find work |
4 |
4 |
4 |
4 |
4 |
2 |
3 |
4 |
3 |
3 |
|
Earn a good salary |
2 |
2 |
2 |
3 |
2 |
2 |
3 |
3 |
3 |
2 |
|
Questionnaire answers and additional information from interviews is best registered per interviewee but processed and presented “theme wise”.
The national report on the Electrician sector in Sweden discusses the challenges of getting a perfect match, and mentions the importance of the students’ attitude to work, as presented below.
|
Good practice: The Swedish Electrician sector There is no doubt about relevance of the El+E program but there is -needless to say- no perfect match. All companies say that the practical training at school is never enough but they also find the right attitude is even more important; If the mentality does not fit the job, it is no use to work on knowledge and skills. Source: WP4 National Report – Sweden 2020 |
| Previous | Next |