1.D Other sector map examples

Below you can find a number of additional examples of sector maps providing a complete picture of a specific sector: The first two include a possible third dimension to be added to the concept of a sector map.

Example 1 Installation technology

A number of additional examples of sector maps providing a complete picture of a specific sector.

This sector map example shows the full variety of jobs in the installation technology sector. On top of the large variety in content of jobs, the third dimension adds the context to this variety: the type of product markets and clients that the companies work for.

Example 2 Metal working industry

Metal working industry
EQF level Design, Drawing & Work preparation Casting & Extrusion Machining Sheet metal working Surface engineering Construction Assembly & Disassembly Mechatronics Service & Maintenance Management & Support
5 Designer/ Constructor (engineer)       Surface technician       Service technician  Director Manager
4 Chief drawing office Work planner (senior) Foundry technician Precision engineer Model maker   Electroplating technician Mechanical engineer All-round machine builder All-round mechanic mechatronics Service engineer Sales representative Workplace trainer
3 Calculator Draftsman Quality controller Founder Caster Moulder Melter All-round CNC machinist CNC programmer Toolmaker Instrument maker CNC sheet metal worker Galvanizer Sprayer All-round construction worker All-round welder Machine builder Senior mechanic/ tester mechatronics Maintenance engineer Purchaser
2 Junior mechanical draftsman Junior foundry worker Junior machinist (junior) Sheet metal worker Junior galvanizer Junior sprayer Construction worker Welder Assembly mechanic Demolition worker Mechanic mechatronics   Warehouse worker
1   Production assistant Production assistant Production assistant Cleaner
Polisher Swabber
Production assistant       Cleaner


This sector map of the (Dutch) metal working industry shows a great variety in branches and companies: forging, casting and extrusion companies, machining companies, sheet metal companies, surface engineering, construction companies, building construction, yacht and shipbuilding companies, mobile equipment, agrotechnical companies, metal ware manufacturing companies, instruments and tools, machine and equipment construction, service and maintenance companies, recycling companies, electrical engineering companies, aircraft construction and maintenance companies. This diversity can be showed in a third dimension.

Example 3 Builders’ merchants sector


Level Logistics Sales office Field & showroom
5 Logistic manager Product manager Marketing manager
4 Chef expedition Technical specialist Account/area manager
3 Storekeeper Back office / sales employee Field worker
2 Warehouse
employee
Desk clerk Receptionist
  • Around 10.000 workers in about 600 companies
    • 50% works in a technical/commercial job
    • 30% works in logistic jobs (with client contacts)
  • “Triple craftsmanship”
    • Technical (products and their application)
    • Logistical (the right stuff at the right place and time)
    • Commercial (thinking like a contractor)

Example 4 The beauty care sector

The sector is divided in three branches. The (content of) two jobs highlighted in the middle can also be shown in a completely different way

EQF level Hair dressing Beauty care Pedicure
5 - Skin therapist -
4 - All-round beautician Medical pedicure
3 Hairdresser Beauty specialist Pedicure
2 Junior hairdresser Nail stylist -


The two highlighted beauty care jobs in the middle can also be shown in a completely different way of mapping out

The two highlighted beauty care jobs in the middle can also be shown in a completely different way of mapping out

This industry is actually more of a professional association and this image is more an overview of job content and its development, from EQF level 3 to 4 and further into higher VET specialisations.


Previous   Next

1.C Statistics in sector map

Indicator 5 of EQAVET is the placement rate in VET programmes. It is about the destination and employment of VET graduates: the quantitative match of VET supply and labour demand, in particular:

  1. The proportion of VET programme completers who are placed either in the labour market, further education or training (including university) or other destination within 12-36 months after the end of programme;
  2. The percentage of VET programme completers who are employed one year after the end of training.

Timely, valid, reliable and comparable statistics are crucial to inform policy formulation, implementation and evaluation, labour market research and goal setting and monitoring.

Therefore, it is useful to collect and visualize both labour and VET data on the sector map, using a similar set up to present the numbers and percentages of labour and VET concerned.

Such labour and VET statistics can derive from different types of sources, including:

  • Consultations through direct contacts with sectors representatives
  • Consultation of existing online databases
  • Population censuses
  • Household surveys
  • Establishment surveys

The quality and meaning of the statistics produced depends on the characteristics, strengths and limitations of the source(s) used.

STATISTICS ON THE LABOUR MARKET

Labour statistics, as a body of official statistics, encompass a wide range of topics and are linked to work, productive activities, workers, characteristics of the labour market and its operating ways. They are extremely useful to understand labour markets, in particular to identify labour market issues and deficiencies, informing policy formulation, enabling policy evaluation and allowing for macroeconomic monitoring. At the same time, the labour market perspective is among the most important criteria in career choice, being placed in fact in 3rd place (after interest and talent).

OPERATIONAL INSTRUCTIONS

STEP 1 Search for and collect quantitative data at National/Regional level. At this level it could be difficult obtaining precise data.


In the table below the type of data needed are indicated. The more correct the numbers, the easier it is  to outline figures such as possible shortfalls and surpluses, for instance.

For each “Occupation” level, data to collect refer to:

  • Number of workers
  • Percentage of certified employees: workers who obtained the diploma for the relevant VET programme (if the percentage is low, it might be interesting to find out what the concurring recruitment channels are)
  • Number of work placements, to understand if they are sufficient
  • Number of vacancies
  • Percentage of vacancies that are hard to fill: vacancies open for longer than 6 months
EQF lev. Occupation #
Workers
%
Certified
#
Work
placements
#
Vacancies
Hard
to fulfil
-   ? ? % ? % ? %
-   ? ? % ? % ? %
-   ? ? % ? % ? %


Example 1 Electricians in Sweden

EQF Occupation #
Workers
%
Certified
#
Work
placements
#
Vacancies
Hard
to fulfil*
4 Leading/Senior Electrician 5.000 ? % ? % 450 80%
3 Electrician 20.000 ? % ? % 1.500 60%
2 Assistant Electrician 20.000 ? % ? % 1.432 60%


Concrete examples from the QSE-VET project are provided below, with reference to the Italian Finance and Banking Sector:


Example 2 Italian Finance and Banking staff

The numbers of employees in the jobs concerned are given in the next table.

EQF Occupation #
Workers
%
Certified
#
Work
placements
#
Vacancies
Hard
to fulfil*
5 Area Branch Coordinator 997 100 % ? % 0 0%
4 Branch Manager 24.932 100 % ? % 0 0%
3 Vice Branch Manger 17.452 100 % ? % 0 0%

STATISTICS ON IVET

Statistical data over time show trends and provide qualitative and quantitative information for European policy making and analysis and monitoring of Vocational Education and Training (VET).

OPERATIONAL INSTRUCTIONS

At this point training programmes have been classified and compared to the job profiles (I. B)

STEP 1 Search for and collect quantitative data regarding the matching iVET programmes for the job concerned.

For each iVET programme data required are:

  • Duration (year/s) of those iVET Program
  • Number of students enrolled
  • School leavers and graduates per year
  • Flow through: percentage of students not entering the labour market, having decided to continue their learning

To be able to compare numbers on labour with those on iVET, it is advisable to present them in a similar way to the data collected for labour market purposes.

The following table shows the type of data required:

EQF lev iVET programs Duration #
Students
#
Graduates
Flow
through
-         %
-         %
-         %


Collected data provide information regarding:

  • the matching iVET programmes for the jobs concerned
  • the duration of those programmes
  • how many students, school leavers/graduates per year
  • how many students will (not) be available for labour (because they are continuing their learning at a higher level)

See section “III. How to establish the (mis)match in QUANTITY

Here (below) there are examples of tables filled in with statistical data provided by Partners of the QSE-VET project in the different areas of investigation chosen.


Example 1 Dutch VET for electrical engineering


EQF iVET programs Duration #
Students
#
Graduates
Flow
through*
4 Technician electrical installations (housing and utility) 3-4 yr 380 90 5%
3 1st mechanic electrical installations (housing and utility) 2-3 yr 1.600 507 20%
2 Mechanic electrical installations 2 yr 2.880 870 60%


* these students move on to further education and not (yet) in work


Example 2 Italian Finance and Banking Sector

EQF iVET programs Duration #
Students
#
Graduates
Flow
through
4 Technical Commercial Institute – Legal Business address 5 yr 342.647 total (for 3 addresses: tourism, social activities and commercial)   %
4 Management, Finance and Marketing Technical Institute 5 yr     %
EQF VET programmes  (internal mandatory training) Duration #
Students
#
Graduates
Flow
through
4+ MIFID 30 hours min.   /  
4 IVASS 30 hours min.   /  


Example 3 The UK kitchen staff

EQF iVET programmes Duration #
Students
#
Graduates
Flow
through*
2 Kitchen Assistant: Level 1 Award in Introduction to Employment in the Hospitality Industry; Certificate in General Cookery; Level 2 in food Safety; NVQ Level 2 in Food Preparation and Cooking and Food Service Guided Learning Hours range from 69 for introductory courses through to 170 for Food Preparation and Cooking for example ? ? ?
3 Cook/Chef de Partie: Foundation Degree in Culinary Arts, Professional Cookery; Higher National Diploma 12 weeks-2 years* ? ? ?
4/5 Head Chef: University Degree in Culinary Arts, Hospitality Management, Professional Cookery; Higher Level Apprenticeship; Higher Level National Diploma 3-4 years+ if specialist areas are chosen ? ? ?


More examples:

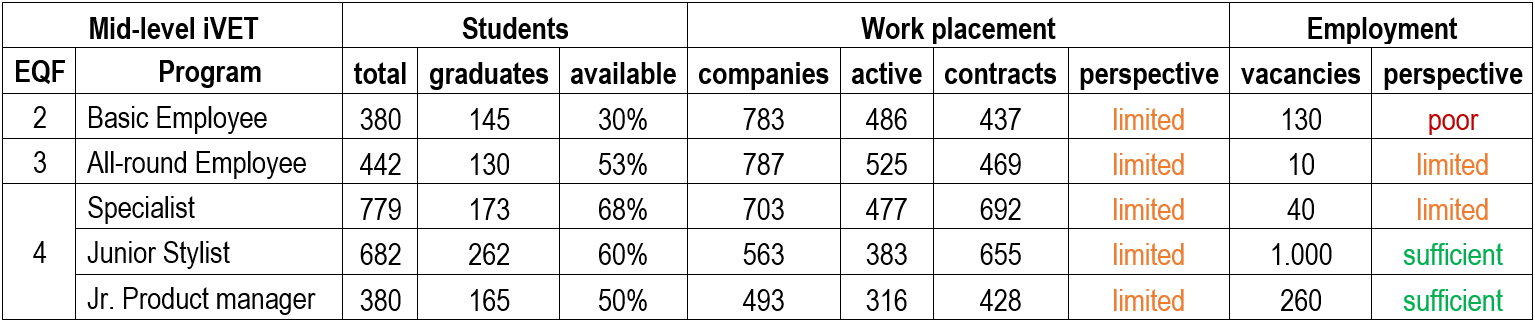
The Dutch fashion-making industry

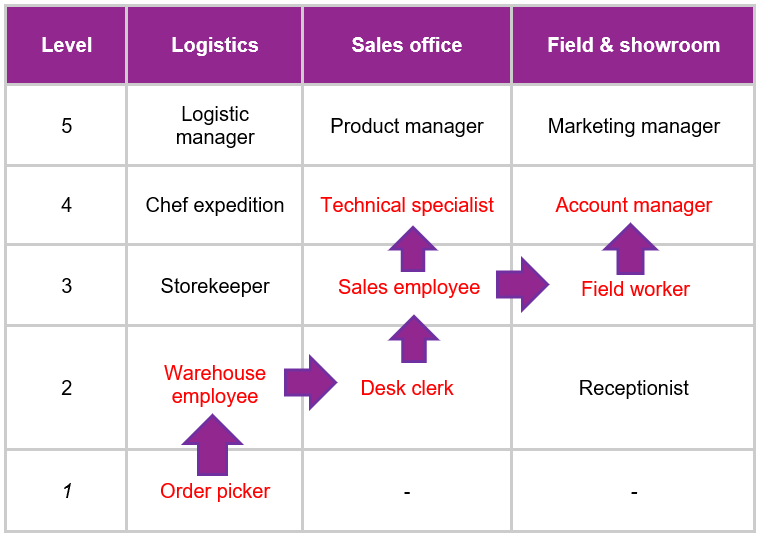
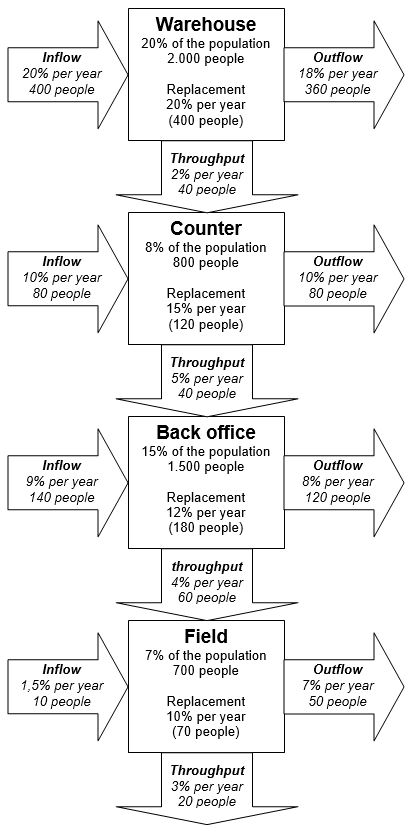
The Dutch building merchants’ core staff mobility

The total replacement demand is on average just over 12% per year.

The in- and through flow (in the core functions) determine the targets for the sectors’ most relevant training programmes.

The annual innovations in the field and (average) performance of the people determine the need for further training on professional knowledge and development of professional skills and personal effectiveness.

The technical advisors of the manufacturers are therefore involved in a biennial review / update of the teaching materials of the various training programmes.


The Greek statistics on VET and labour

Type of enterprises in sector in Greece Number of enterprises Number of employees
Restaurants and mobile  units 41.171 209.182
Catering services 3.435 11.428
Fast food services & Cafe 81.593 379.041
Total 126.199 599.651


Type of enterprises in sector in Greece Number of enterprises Number of employees
Restaurants and mobile  units 41.171 209.182
Catering services 3.435 11.428
Total 44.606 220.610


EQF Occupation #
Workers
%
Certified
#
Work
placements
*
#
Vacancies
*
Hard
to fulfil**
4 Head chef 9.854 86% N/A N/A 80%
3 Cook/chef de partie 47.359 64% N/A N/A 60%
2 Kitchen porter/assistant 163.397 11% N/A N/A 30%
*There is not any available data per occupational profile. The statistical interpretation of the data related to work placement and vacancies are provided in total. **DIMITRA’s approach based on iVET data


iVET programme Number of graduated students (2017-2018) Number of students participated in the certification exams Number of certified students Percentage
Food/cook art Approx. 18.000 11.352 8.548 % of graduated: 47.49% % of participated in the exams: 75.29%

  The UK statistics on VET and Labour

EQF Occupation #
Workers
iVET programs Duration
4/5 Head Chef 255.000 University Degree in Culinary Arts, Hospitality Management, Professional Cookery*; Higher Level Apprenticeship; Higher Level National Diploma 3-4 years+ if specialist areas are chosen
3 Cook 190.000 Foundation Degree in Culinary Arts, Professional Cookery; Higher National Diploma 12 weeks-2 years*
2 Kitchen Assistant 234.000 Level 1 Award in Introduction to Employment in the Hospitality Industry;
Certificate in General Cookery;
Level 2 in food safety;
NVQ Level 2 in Food Preparation and Cooking and Food Service
Guided Learning Hours range from 69 for introductory courses through to 170 for Food Preparation and Cooking for example


* Professional Cookery: Level 1 Diploma: 12-weeks; -weeks; Professional Chef – Level 3 Diploma: 1-year

  • The Hospitality Sector has the lowest proportion of full-time employees out of all sectors and
  • Employs a particularly young workforce (33% <25 years old); 10% are employed on a temporary basis
  • The majority of establishments in the sector (approx. 91%) employ fewer than 25 people.
  • The sector is relatively low-skilled; only a fifth of the workforce is qualified to level 4 and above, though this varies by sub-sector
  • In terms of recruitment issues, 32.700 establishments (15% of all sector establishments) have vacancies; 5% report hard to fill vacancies, with 3% reporting skills shortage vacancies
  • A total of 73.700 vacancies were reported across the sector; a quarter of these (18.243) are hard-to-fill and a further 15% (11.178) are skills shortage vacancies
  • 61% of hospitality employers provide training
  • Restaurants are slightly less likely to provide training (50%)
  • 85% of employees receive health and safety/first aid training
  • 63% of employees receive induction training
  • By far, the reason employers to not provide training is that they say that staff are fully proficient (62%).

Given the vacancies reported, there are plenty of opportunities for students to find work.


Previous   Next

1.A How to map out jobs?

Occupations and VET programmes are placed in a sector map in two dimensions: level and content.

  • Level: determined by levels of education, aligned to the European Qualification Framework (EQF)
  • Content: determined by division into dominant/different work processes (and associated areas of knowledge and skills) and corresponding jobs and careers in the sector

The content of work in a sector is usually structured by the dominant work processes and professional disciplines, which can be distinguished within the internal organization of companies. VET programmes normally reflect such a classification of work processes.

Jobs in context

The table below represents a simple and empty sector map. The filled-in table gives a clear idea of the organizational context people are working in as well as discriminating the job in focus from the surrounding jobs. It provides an immediately recognizable image and a background for collecting quantitative data.

Table 1

SECTOR
EQF
level
Work Processes e.g. Planning and Management Work Processes e.g. Operational Commercial Work Processes e.g. Supervision and Control
6      
5      
4      
3      

The vertical dimension (rows) of the sector map is the level of work/thinking/education, following the EQF scale, which is generally in line with wage scales.

The horizontal dimension (columns) follows the layout of the sector/companies/work concerned. The content of work in a sector is usually structured in different work processes and professional disciplines, which can be distinguished within the internal organization of companies. Corresponding VET programmes normally reflect such a classification of work processes. 


Operational instructions

STEP 1 Define a sector/profession on which to focus

STEP 2 Set up a small working group of stakeholders, committed to the goal and interested in providing inputs and using outputs

STEP 3 Choose a job within a defined range of EQF level to make results comparable. For the best results, choose 3-5 connected jobs.

STEP 4 Choose the (core) occupations at consecutive levels

STEP 5 Place them in the sector map - as shown in the examples below:

Nota bene: in theory you take successive steps. In practice, however, it is an iterative process, moving back and forth between them

The examples provided focus on craftsmanship at mid-level iVET, therefore range between Level 2 to 6 of EQF.  The jobs chosen are those three (in each example) highlighted.

Example 1 Swedish electrical installation technology for housing and utility building

Sector: Electrical installations in housing and utility building

Work processes

EQF
levels

Preparation,
Logistics
and Planning

Installation, Service
and Maintenance

Management
Administration
and Support

6

Technical Manager

Operational Manager

General/Commercial Manager

5

Project Manager

Head Execution
Service Manager

Controller, HR officer

4

Planner/Engineer

Technical Specialist
Leading/Senior Electrician

Office Manager

3

Draftsman

Service Engineer
Electrician

Bookkeeper
Secretary

2

Warehouse
Worker

Assistant Electrician

Administrative Assistant

The focus in the QSE-VET project in Sweden has been on the three highlighted jobs in the middle. For inspiration take a look at 1.D Other options “Example 1. Installation technology” for a fuller image of the (Dutch) installation sector. 

Example 2 Local regional branch banking staff in Italy. The focus of the QSE-VET project was on lower middle management at local / regional level.

Italy’s Commercial Banks - Retail
EQF
level
Planning and Management Operational Commercial Supervision and Control
6 Regional manager Personal Planner General Supervisor
5 Area branch coordinator Personal Advisor Compliance Manager
4 Branch manager Investment Practitioner Risk Manager
3 Vice branch manager Daily Banking Advisor Risk and Compliance Officer
 

Example 3 kitchen staff of the UK and Greece. The focus in the QSE-VET project was on restaurants and catering services. The related departments and professions have been left out because they can differ greatly depending on the nature of the organization of which the kitchen is part.

British and Greek Kitchen staff
EQF Level Occupations
5 Executive chef
Head Chef
Sous chef
4
3 Cook / Chef de partie
Commis chef
2 Kitchen Porter

What emerges in all examples above is the immediate awareness of one’s position and the directions that are possible, in terms of professional development. Table 2: directions of professional development.


STEP 6 It is possible to recognize and provide mobility suggestions in small steps to move from one job to another, in line with the professional growth of the employee and the opportunities provided by the organization. It is up to the sector and companies to articulate the demand for VET support to accommodate the mobility desired.

Example “Table 3”: Job transition for builders’ merchants [1]

The arrows in this table not only indicate the direction of mobility, but also refer to the different training modules that are offered, partly in collaboration / in combination with vocational education.


Previous   Next

1.B VET in sector map

Vocational education and training can ease the transition from school to work, whilst supplying employers with trained workers. VET programmes are relevant for the labour market, insofar as they are transparent as to what job(s) is being trained for as well as the further career possibilities offered to the students (and their employers).

Thus, training programmes are purposefully descriptive and aimed at covering future needs. They are required to be flexible and able to cover generic learning outcomes that are adaptable to different contexts and organizational situations, i.e. for broader or narrower job profiles.

Employers usually think in terms of the tasks to be performed, while VET Providers think in terms of Knowledge and skills to be acquired.

The relevance of VET programmes is continuously challenged by future needs and changing criteria. The match between VET programme supply and labour market demand is better made when three dimensions are present:

  1. in terms of quantity: relevance for students and the labour market to provide the expected volume of vacancies.
  2. in terms of quality: relevance of knowledge and skills on the right level to provide for current as well as future job demands. It is about having the right content and the right way of presenting it to students. (See the section on job profiling “II. Creating a common language through job profiles” and the one measuring the match in quality “IV. How to establish the (mis)match in QUALITY”).
  3. In terms of spread (geography and time): education and available workforce at the right time and in the right place.

Assuming a certain distance between VET programmes and job requirements, how can VET providers and sector policy makers narrow the gap?

The challenge for iVET programmes is to match two worlds: students (and their parents) who need education that provide possibilities that matches their ambitions but also gives them a good start in terms of  employability in the labour market; working society/ the labour market which needs well-trained workers but is hardly capable of defining what is needed. Students are the customer of education as well the product for the labour market.

The evolution of jobs is aligned to the changing skills and knowledge. VET programmes drive the provision of professional knowledge, skills and the allocation of talents.

With a view to providing quality VET programmes, VET providers have to be open and seek dialogue with relevant stakeholders and react quickly to changes that are required.. The sector map supports this purpose, describing the labour and VET market within one recognizable and clear context, thus aligning VET programmes with jobs.

OPERATIONAL INSTRUCTIONS

STEP 1 to project the career on the sector map, plot/outline learning path along the same coordinates of level and content.

VET programmes are dominantly classified by their level. The European Qualification Framework (EQF), for instance, distinguishes 8 of those levels.


For inspiration take a look at https://ec.europa.eu/ploteus/content/descriptors-page

QUALIFYING VET Programs
Work processes  Work Processes Planning and Management Work Processes Operational Commercial Work Processes Supervision and Control
EQF
levels
-      
-      
-      
-      


If the jobs concerned require certain certificates, it is important to match them with training programmes to obtain them.


STEP 2 Match VET programmes with the associated jobs

To compile the sector map, make a reference to the VET programmes relevant for the jobs concerned. Characteristics (tasks and competences) of the specific job are matched with the relevant VET programmes available.

Where no relevant VET programmes are available, creating blind spots in the table is likely to find similar vacancies hard to fulfil.

This perspective - matching jobs and VET programmes - immediately shows the gap between Vocational Education and the world of work.


In the examples below, the sector map of installation technology is filled with jobs (Table 4) and VET programs (Table 5).

Table 4

Installation technology jobs

Level Cooling Heating Service and maintenance
5 Project manager Project manager Project manager
4 Senior mechanic Senior mechanic Service engineer
3 Medior mechanic Medior mechanic Service man
2 Junior mechanic Junior mechanic Assistant
1 Assistant Assistant -

Table 5

Installation technology VET programmes

Level Cooling Heating Service and maintenance
5 Graduate program No VET programs available No VET program available
4 Intermediate programs Intermediate programs
3 Intermediate programs
2
1 General basic program Irrelevant


For inspiration take a look at “I.B.1. Sector map”


Previous   Next

1. Designing a SECTOR Map

The current dynamism and complexity in labour markets demand an improved matching system between job requirements and VET programmes.

Instruments such as the ‘sector map’ are a prerequisite for transparency and good communication between education and the labour market at a regional level, also supporting dialogue on increasing VET relevance for the labour market.

A ‘sector map’ provides a frame of reference for the occupational domain of a sector, positioning jobs in their professional context in relation to VET programmes and vice-versa: it helps you to link jobs and careers with VET programmes and learning pathways. For policy-makers, it provides a common reference framework.

It can also help students (and their parents) and workers to determine their present position and target their ambitions, including the ways to get to their desired destination. In other words, it provides an overview of career possibilities and corresponding learning pathways to plan the future.

WHY SECTOR?

Different perspectives can be taken into account to analyse and describe the labour market (and its demand for new workers in sufficient numbers and at the right level of craftsmanship:

  1. International
  2. National
  3. Sector/branch
  4. Region
  5. Job/Profession
  6. Organization
  7. Individual

A Sectoral focus is the most relevant scale for (national) VET policies and programming, as well as essential in anticipating changing skills needs. A 'sector' can be described as a collection or community of companies/organizations that share a specific market. Organizations in a sector have similar clients, similar work processes, similar employees who need similar education and training, with similar craftsmanship and a body of knowledge that is often also (partly) shared with customers and suppliers.

Because of the consistency (in labour and VET) at a sector level, it is relatively easy to make a meaningful ‘map’ and to monitor the markets of business, labour and education. The (future) requirements, in terms of jobs and skills, are influenced by national and international trends and developments - but have to be determined on a sectoral and regional scale to be translated into an individual match between employees and jobs in an organization, or between students and VET programmes.

The concrete match between the labour market and VET programmes is made in the regional context, where demand and supply really meet, varying through different and overlapping sectors and branches, but within relatively short travelling distances.

SECTOR MAP MAIN FEATURES

Made up by two dimensions, level and contents (on jobs and education), a map offers a clear overview of the sector and branch as a whole, describing the labour market and VET within a recognizable, clear and simple context to identify career and learning paths. The sector map provides a common background for:

  • types and levels of professions/jobs
  • career development and mobility
  • corresponding VET programmes
  • statistical information on labour, mobility and education

Moreover, it is applicable to every sector and the different associated target groups:

  1. Companies and employees, in terms of staff planning and career development
  2. School leavers (and their parents) and job seekers, providing information and recruitment for profession and training
  3. Researchers and policy makers, who can be aware of numbers of people, inflow, through and outflow, growth and contraction, shortages and surpluses
  4. VET providers and other training suppliers, to obtain useful information regarding job requirements and actual levels of demand and supply

ADVANTAGES OF THE SECTOR MAP

Developing a map provides a clear and immediate overview and a common reference framework to support and add transparency to the dialogue between (VET) education and Labour. Stakeholders need a common frame of reference to set the scope and define the domain, in a way that is understood by both the worlds of work and of learning. Each cell of the map contains a job or a consistent group of jobs. The corresponding VET programmes can be projected onto the same grid to see whether there is a fit between jobs and VET supply. It is also possible to project quantities of workers; the yearly outflow and need of new entries can be projected to determine the amount of vacancies. This can help to quantify the shortage or surplus. The same can be said about demand and supply in traineeships.

The map also provides a background to explore dynamics in the sector, in relation to the mobility of workers and job innovation. For instance: How many order pickers would like to be trained in their commercial skills to make a step towards a counter job? Which VET programme facilitates that career? Or: Which jobs are affected by the implementation of ICT systems? What programmes do we have available to train the various employees? Instruments such as the sector map are a prerequisite for good communication between education and labour market at the regional level.

The sector map is not only relevant to describe the present and future situation for policy makers but also acts as a practical instrument for individual professionals and the companies they work for. It can be used as a 'roadmap' for individual professional development and career planning. It also gives companies an instrument for planning staffing and development in terms of quality and quantity (inflow, internal mobility and outflow). The sector map provides a frame of reference for labour and VET programmes at a high level. It helps policymakers to be well aware of their domain, to analyse the situation and to determine their scope.

OPERATIONAL INSTRUCTIONS TO MAKE A SECTOR MAP

Designing a Sector Map can be very easy and useful. The following steps will lead you to your ‘Sector Map’:

STEP 1 Map out the jobs to provide the context (I.A.)

STEP 2 Contextualize the relevant VET offer (I.B.)

STEP 3 Collect and present quantitative data regarding labour and VET (I.C)

CRITICAL CONDITIONS

When capturing the relation between VET programmes and the labour market in a sector map, it is always advisable to consider the dynamics on both sides - and the different trends and challenges due to the changing future, besides other critical conditions, such as:

  • Limitations, due to the existing, defined sector, with 'organized businesses' to work with
  • Engagement in terms of sector support and mutual commitment
  • Representativeness and competences of people and organizations
  • Recognition / validation by companies, unions and VET representatives

This means that a sector map needs to be robust enough to last for a minimum period but also needs to be recalibrated (depending on the sector of reference, every 3 - 5 years on average) to remain accurate as a representation of the ever-changing reality of labour and VET.


Previous   Next